Document parsing
accuracy benchmark

400 pages from public datasets and documents, human-verified region by region and run through 7 providers across seven document types.

Hanji87.5% · 85.6%89.4%
Pulse82.7% · 80.9%84.7%
Reducto75.2% · 73.1%77.5%
AWS TextractLAYOUT + TABLES74.1% · 71.1%77.0%
Doclingdefaults (Heron + OcrAuto→RapidOCR)72.5% · 69.7%75.2%
LlamaParseagentic67.6% · 64.7%70.3%
Unstructured66.8% · 64.0%69.6%
Tested on forms & invoices, image-heavy, multi-column, multilingual, presentations, scanned & degraded, tables & financial
Text accuracy
87.5%
+4.8 vs next best
Word-overlap F1
90.2%
+6.6 vs next best
Grounded accuracy
92.4%
-0.3 vs best
Layout IoU
78.1%
-7.9 vs best

Full results

Hanji leads two of four columns. Means with 95% confidence intervals, sorted by text accuracy.

Gold-set accuracy by provider: means and 95% confidence intervals for text accuracy, word-overlap F1, grounded accuracy, and layout IoU.
ProviderText accuracyWord-overlap F1Grounded accuracyLayout IoU
Hanji
87.5%
85.6%–89.4%
90.2%
88.8%–91.5%
92.4%
91.0%–93.6%
78.1%
76.1%–80.2%
Pulse
82.7%
80.9%–84.7%
83.6%
82.0%–85.1%
92.7%
91.6%–93.8%
80.1%
78.3%–81.8%
Reducto
75.2%
73.1%–77.5%
77.1%
74.8%–79.2%
86.0%
84.6%–87.3%
86.0%
84.4%–87.5%
AWS TextractLAYOUT + TABLES
74.1%
71.1%–77.0%
76.3%
73.5%–79.1%
79.0%
76.3%–81.4%
46.9%
44.9%–49.0%
Doclingdefaults (Heron + OcrAuto→RapidOCR)
72.5%
69.7%–75.2%
77.7%
75.1%–80.5%
82.6%
80.2%–84.9%
74.4%
72.0%–76.7%
LlamaParseagentic
67.6%
64.7%–70.3%
69.7%
67.4%–72.1%
65.9%
63.1%–68.6%
48.6%
46.0%–51.1%
Unstructured
66.8%
64.0%–69.6%
63.9%
60.7%–67.0%
70.4%
67.3%–73.3%
83.0%
81.0%–85.0%

By document type

Grounded accuracy by document type. Hanji holds the highest floor in the field: even its weakest type scores 86.6%, while every other provider drops below that on at least one type. Specialists edge ahead on individual cuts; none stays this consistent across all seven.

Grounded accuracy · tables & financial

Hanji98.9%
Pulse97.6%
Unstructured95.3%
Doclingdefaults (Heron + OcrAuto→RapidOCR)94.6%
AWS TextractLAYOUT + TABLES93.6%
LlamaParseagentic91.9%
Reducto89.9%

Hanji leads this cut by 1.3 points over Pulse.

The pages · 65 documents · 536 verified regions

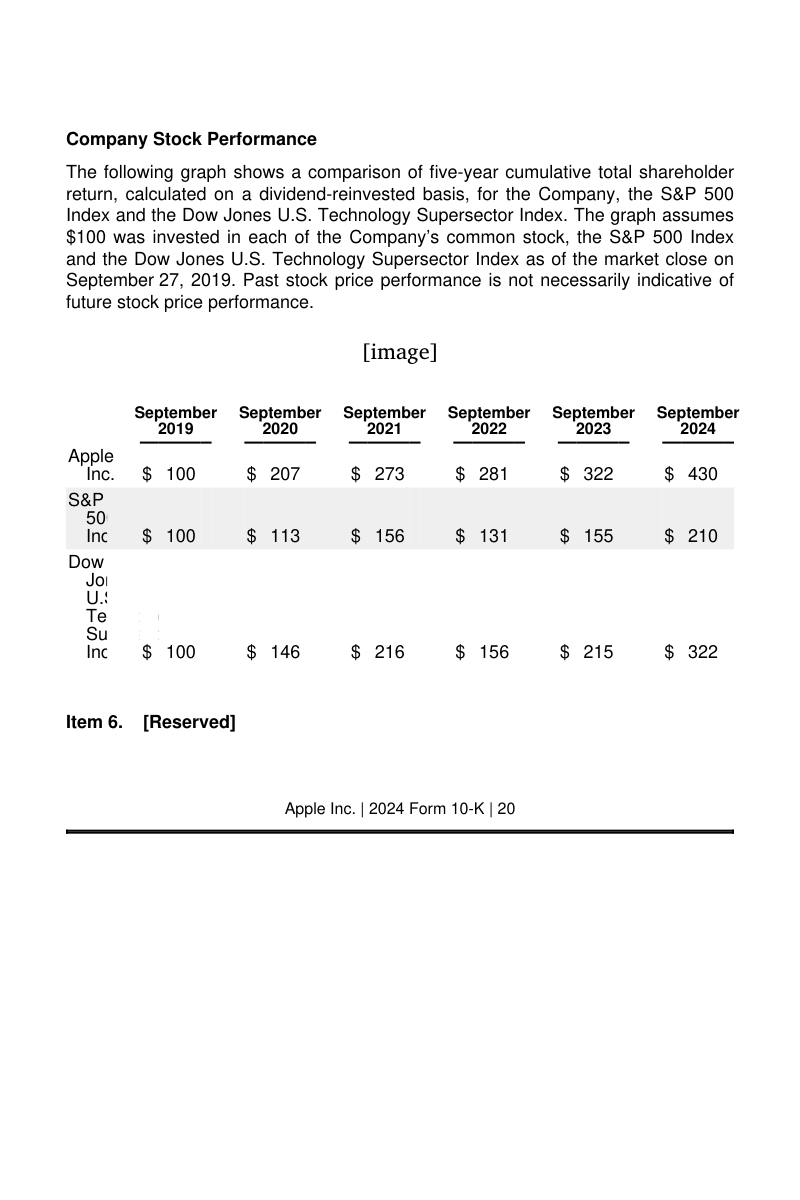
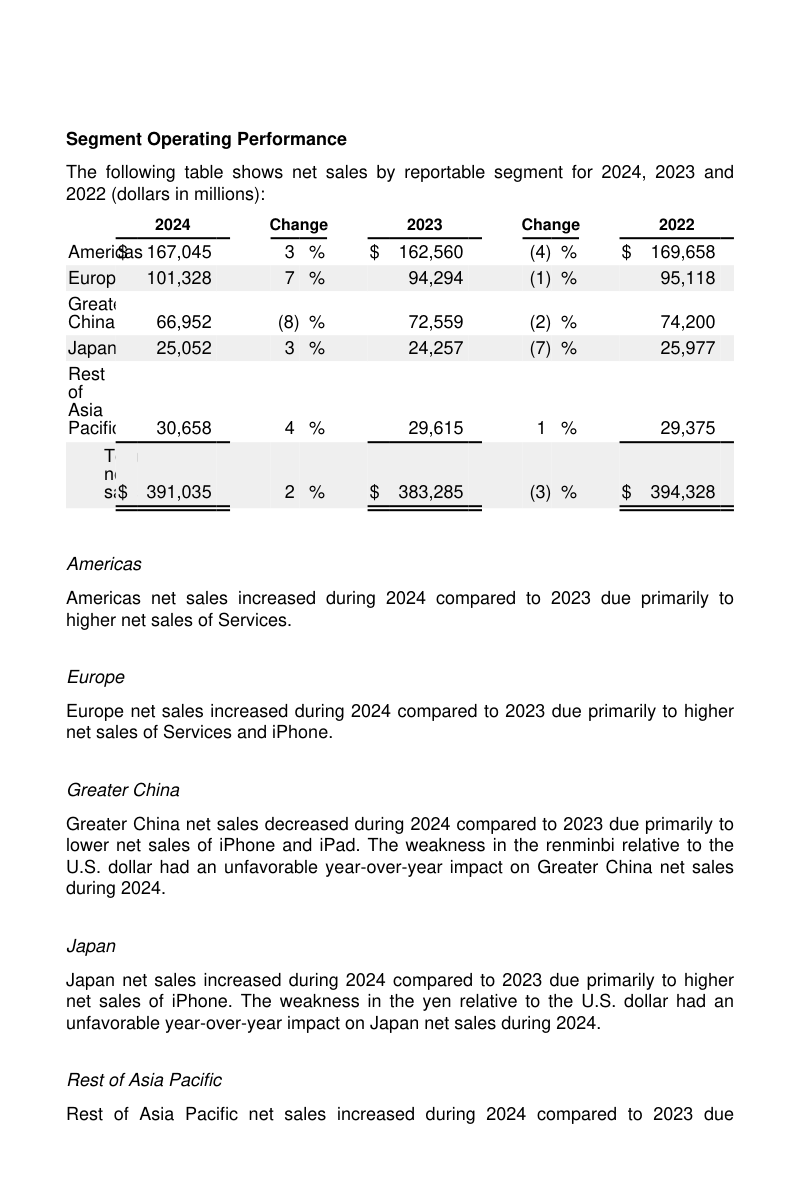
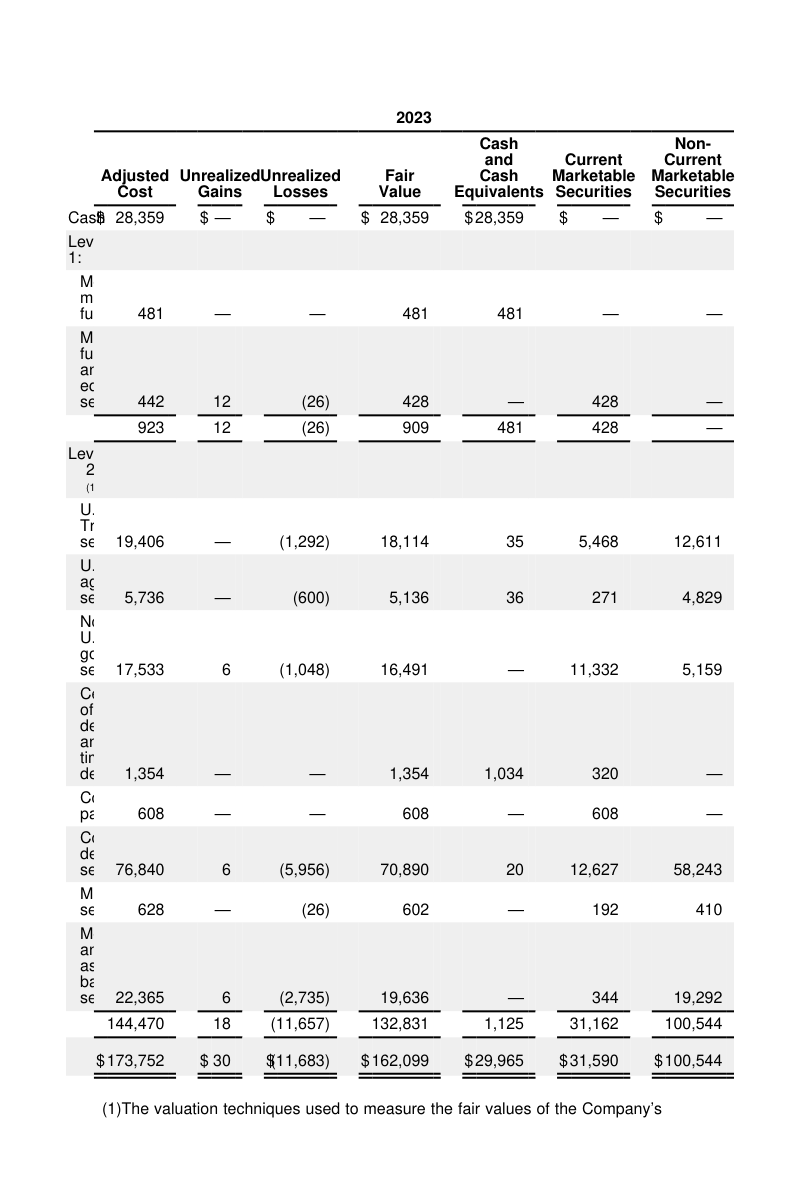
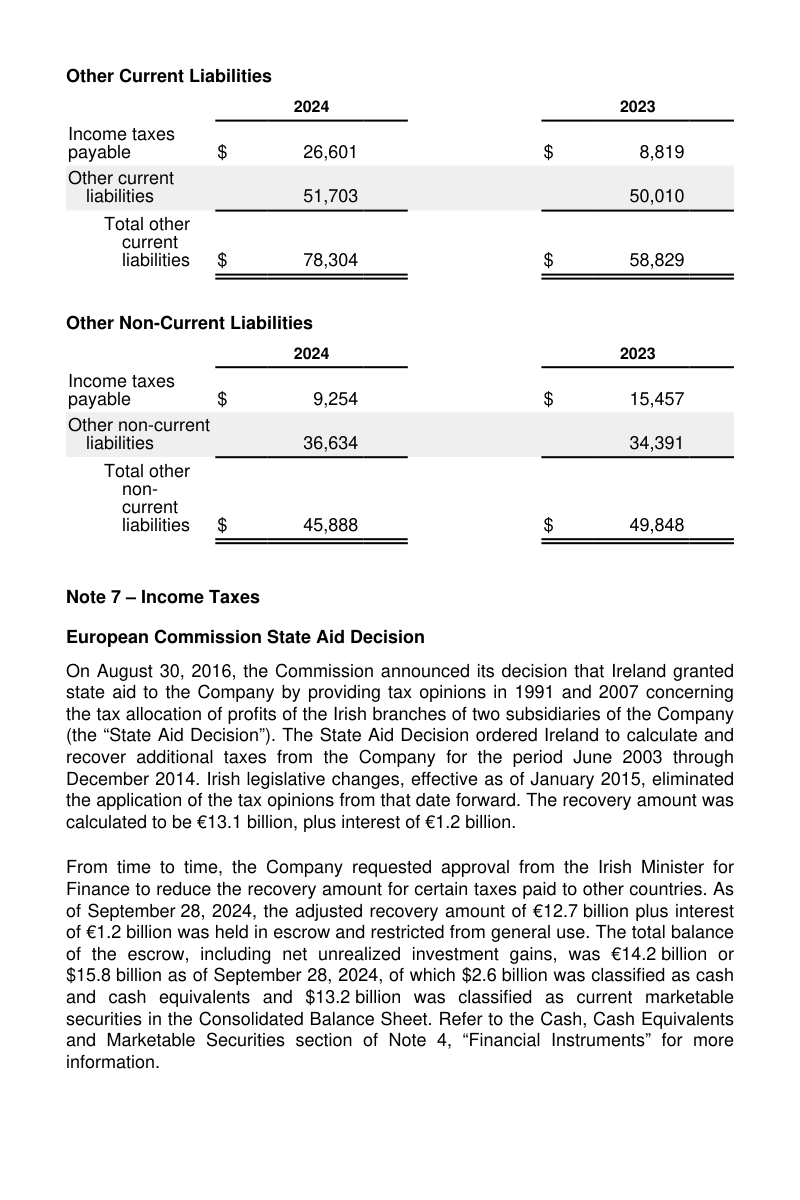
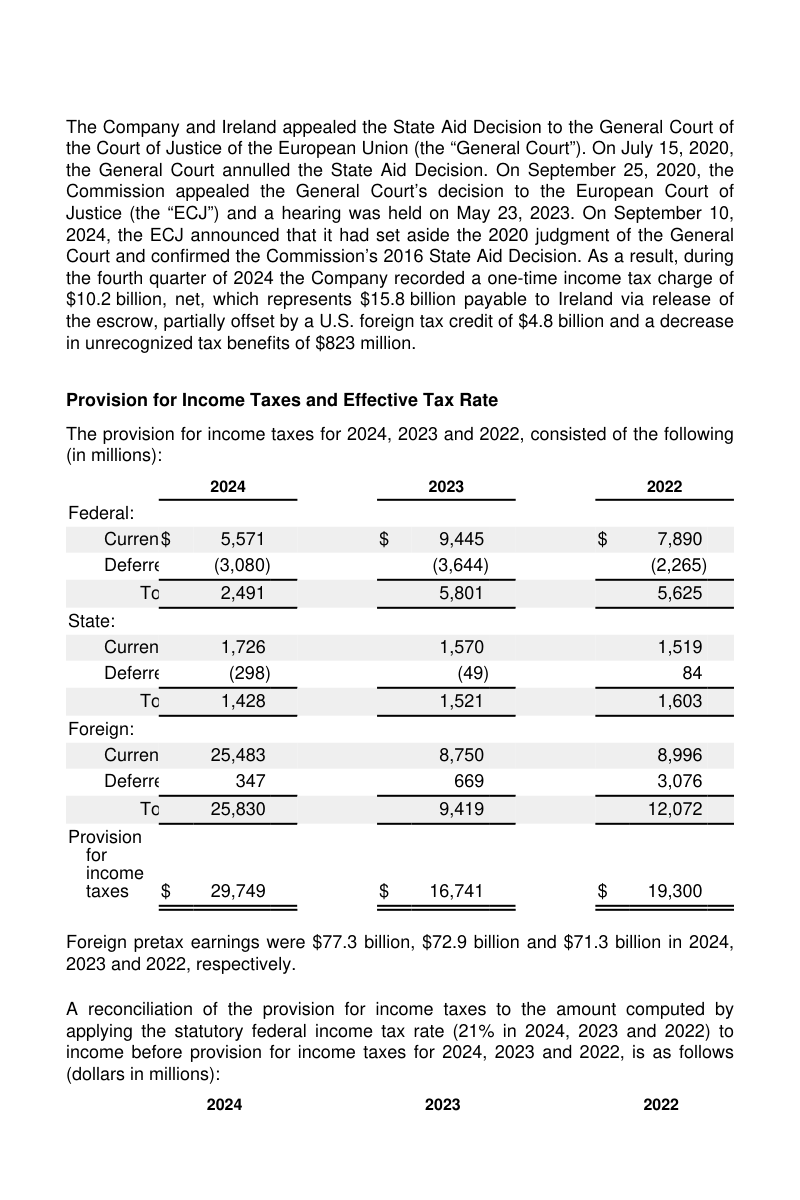
  • Financial table · sec10k_aapl_p0044__p0001, gold benchmark page
    Financial table · sec10k_aapl_p0044__p0001 · 6 regions
  • Financial table · sec10k_aapl_p0047__p0001, gold benchmark page
    Financial table · sec10k_aapl_p0047__p0001 · 7 regions
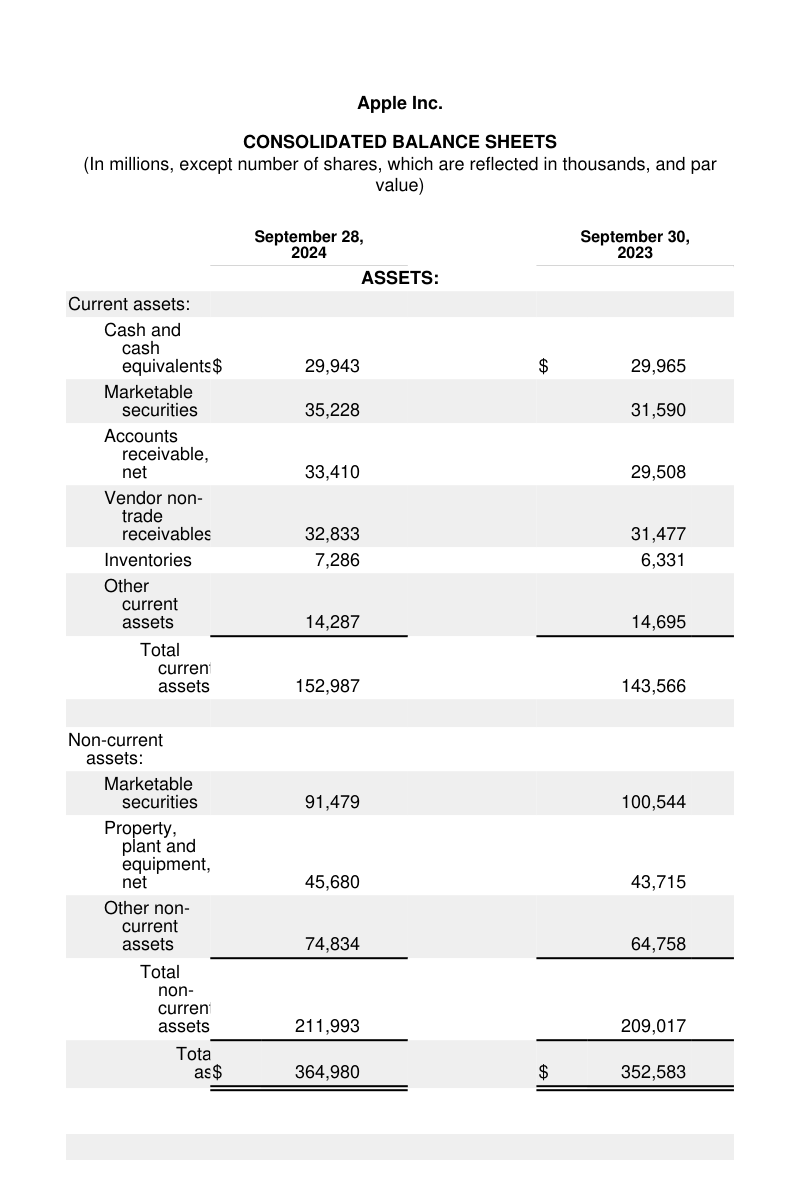
  • Financial table · sec10k_aapl_p0065__p0001, gold benchmark page
    Financial table · sec10k_aapl_p0065__p0001 · 2 regions
  • Financial table · sec10k_aapl_p0079__p0001, gold benchmark page
    Financial table · sec10k_aapl_p0079__p0001 · 4 regions
  • Financial table · sec10k_aapl_p0082__p0001, gold benchmark page
    Financial table · sec10k_aapl_p0082__p0001 · 2 regions
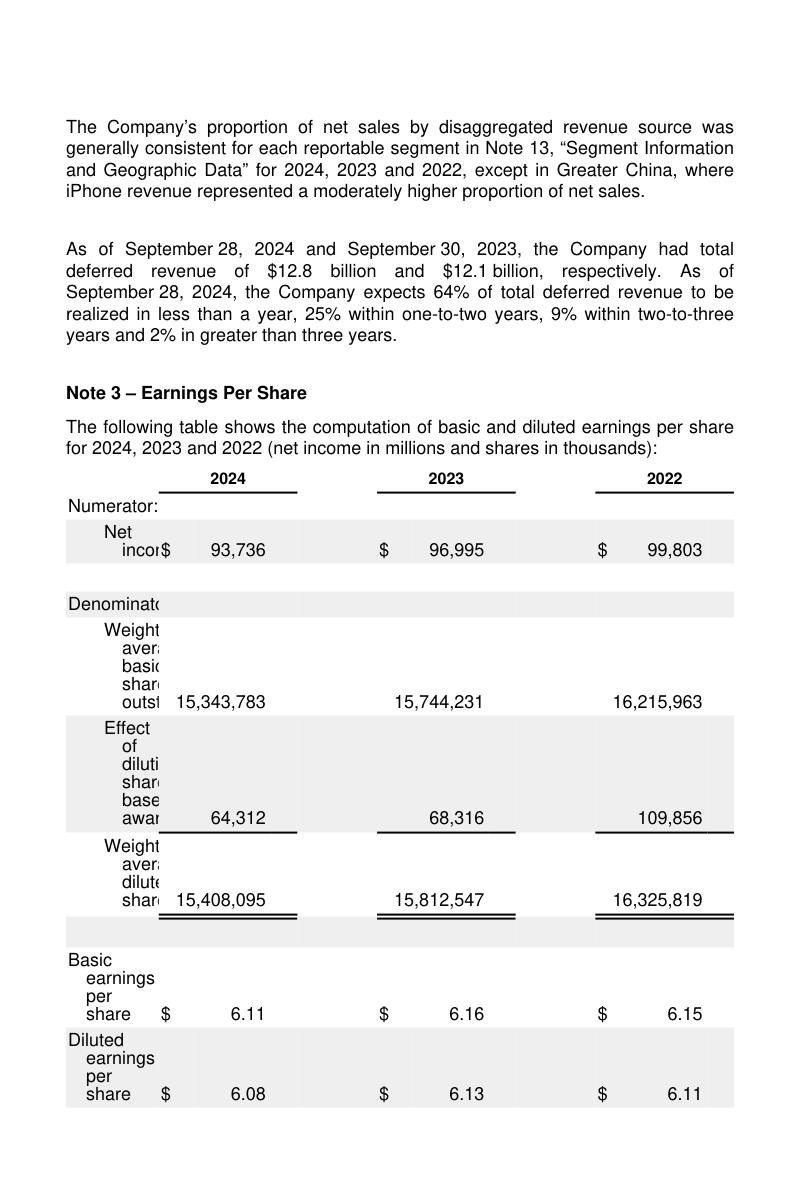
  • Financial table · sec10k_aapl_p0088__p0001, gold benchmark page
    Financial table · sec10k_aapl_p0088__p0001 · 5 regions
  • Financial table · sec10k_aapl_p0090__p0001, gold benchmark page
    Financial table · sec10k_aapl_p0090__p0001 · 7 regions

What we measured

Four metrics, each with its scoring rule. Every score is a document‑level mean with a bootstrap confidence interval.

Grounded accuracy

Hanji 92.4%

For each labeled region we gather the predicted boxes overlapping its location (page-sized dumps are excluded), stitch their text in reading order, and measure how much of the region's text is recoverable in that local context — 11 when the text is contained, otherwise the best-matching window scored by 1NED1-\mathrm{NED}. The metric averages this recall 1Nrrecr\frac{1}{N}\sum_{r}\mathrm{rec}_r over all NN regions, with a region that got no overlapping prediction scoring 0; extra neighboring text from a coarse box is not penalized, so word-, line-, and paragraph-box outputs are scored fairly.

Text accuracy

Hanji 87.5%

Character fidelity over the whole page in each provider's emitted reading order: 1NED1-\mathrm{NED}, where NED=edit distancemax(p,g)\mathrm{NED}=\frac{\text{edit distance}}{\max(|p|,\,|g|)} is the Levenshtein distance between prediction pp and ground truth gg over the longer length. Markdown, case, and Textract LAYOUT table scaffolding are normalized first.

Word-overlap F1

Hanji 90.2%

Bag-of-words overlap, independent of order: the harmonic mean of word precision PP and recall RR, F1=2PRP+RF_1=\frac{2PR}{P+R}. It surfaces which words were captured versus dropped or hallucinated.

Layout IoU

Hanji 78.1%

How well the predicted boxes cover the real content blocks: intersection-over-union of the predicted (AA) and verified (BB) box masks rasterized on a 1000×1000 grid, ABAB\frac{|A\cap B|}{|A\cup B|}, independent of the text inside.

Methodology

All 400 pages span seven document types: forms & invoices, tables & financial, multi-column, multilingual, image-heavy, presentations, and scanned & degraded. They are drawn from public OCR datasets (CORD, SROIE), arXiv pages, lecture slides, SEC 10-K filings, and synthetic multilingual renders. Every page was human-verified region by region against its source. Each score is a document-level mean with a 95% confidence interval from bootstrap resampling over pages. Test pages are held out from training.

Gold pages
400
Document types
7
Providers
7
Confidence
95% bootstrap CIs

Speed and coverage at scale

The larger consensus benchmark asks a different question: across 156 business PDFs and 13,671 pages, who stays fast while remaining competitive with the provider-agreement reference? Corpus mix: financial reports, compliance audits, legal contracts, healthcare and insurance packets, government forms, technical specs, manuals, slides, image-heavy pages, multilingual docs, and scanned/OCR cases.

Hanji p50
10.7s
Consensus F1
98.8%
Success
151/156
Plotted providers: p50 latency, consensus F1, pages per second, and document success.
ProviderModep50 latencyConsensus F1Pages per secondSuccess
AWS TextractLAYOUT + TABLES29.5s99.7%1155/156
Azure DIprebuilt-layout18.2s99.4%1.2154/156
Hanjihosted10.7s98.8%2151/156
Google Doc AIbatch layout75.4s99.6%0.5155/156
LlamaParseagentic29.1s97.7%0.8154/156
Reductostandard parse23.8s99.0%1.2155/156
Consensus F1 is provider agreement against a majority-provider pseudo-reference, not human-labeled accuracy. The gold-set table above is the primary accuracy claim; this section shows speed and coverage depth on the broad corpus. AWS BDA and Mistral OCR cleared the success bar but return no bounding boxes, so they're excluded from the plot. Only providers that completed ≥85% of documents and return grounded boxes are plotted on a log-scale latency axis; latency and pages/sec are medians and consensus F1 is a mean over successful documents. View the full 156-document breakdown →

Show us where it breaks

Bring us the docs your pipeline struggles with. We’ll work through the edge cases and tune Hanji for your workflow.